SAM
+7 (499) 653 51 10
sam@ciced.ru
Facebook
YouTube
Instagram
flagРусскийflagҚазақflagTajik
flagEnglish
  • About SAM
    • Theory
    • Authors
    • History of development
  • How it works
  • Services
  • Documents
  • Contact us
  • Seminar

SAM results

Home SAM results

To illustrate SAM features we use the research that took place in one of the Russian cities. In frames of this research all students of 5th grade of all schools were tested.

graf1-1

Figure 1. School rating by average score. All students participated in testing.  

Graphs show school rating by students average score

graf2-2

Figure 2. Structure of schools average score

SAM allows to see the structure of school’s average score with % expression of students at different levels.

graf3-3

Figure 3. Distribution of students by levels

Graphs represents how the structure of the average score of particular school is formed.

graf4-4

Figure 4. Students individual data on solving of test items of 3 levels 

Graphs show profiles of  students of the same class.

graf5-5

Figure 5. Average score of classes in relation of used teaching approach

Graphs show average scores in relation to the approach  that was used for teaching.  Rating contains all schools.

graf6-6

Figure 6. Structure of average score of classes in relation to the used teaching approach

Graphs show average scores in relation to the approach  that was used for teaching. Rating contains all schools.

graf7-7

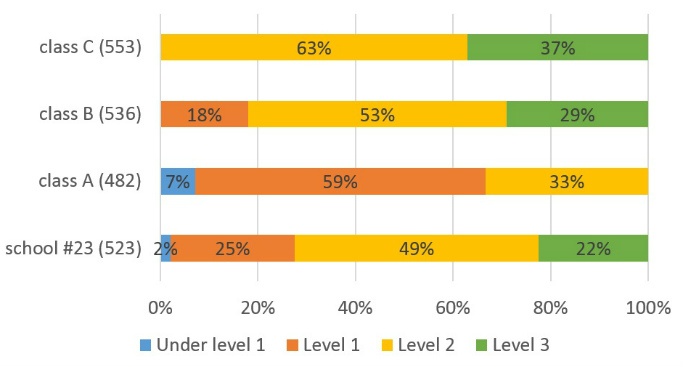
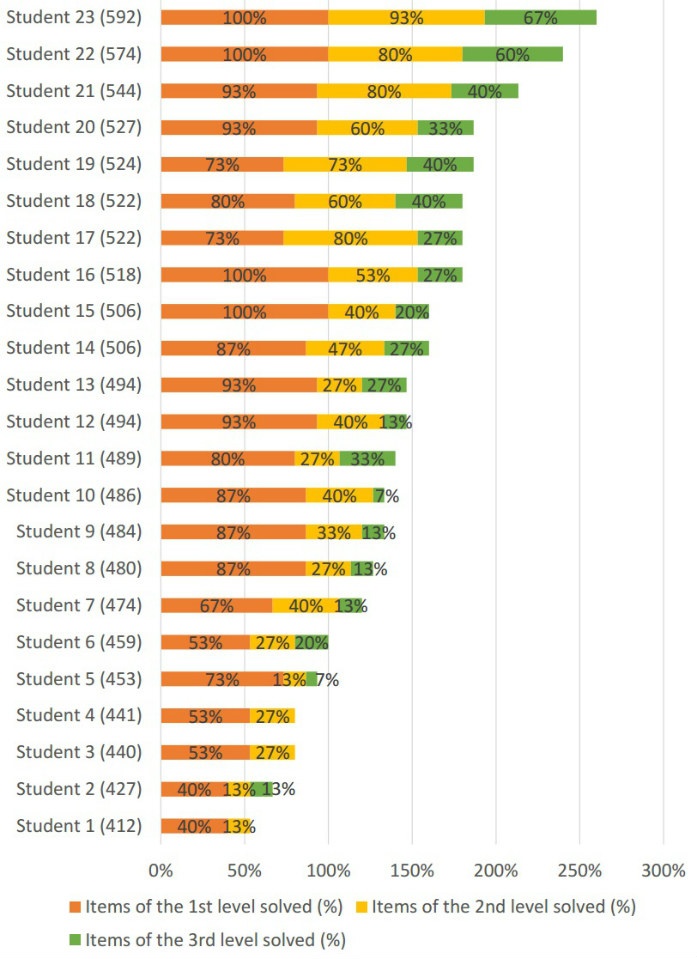
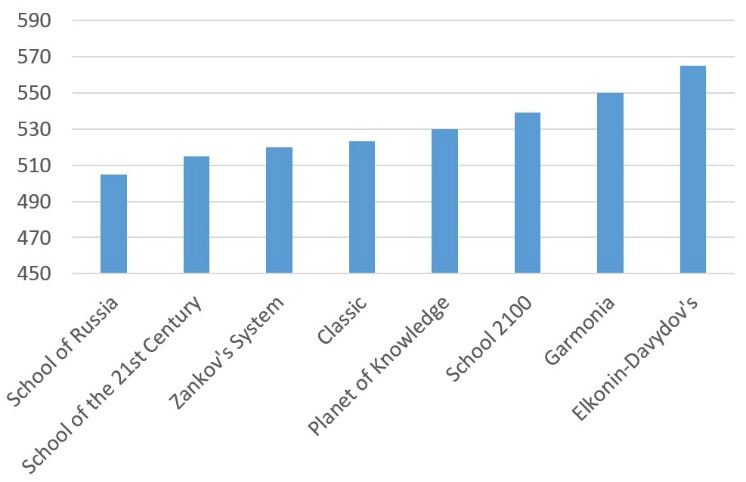
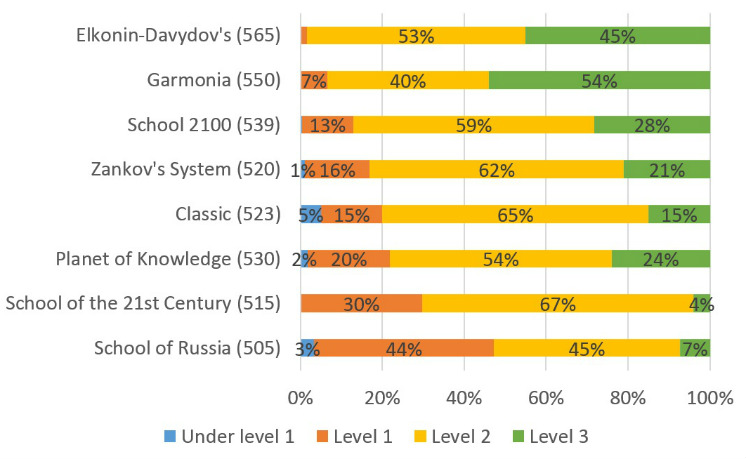
Figure 7. Structure of average score of a school. Different teaching approaches are used in different classes.

 Graphs show the structure of school’s average score. Graphs feature that different teaching approaches  are used in classes. Graphs show the quality of knowledge acquisition in every class and as the result – the contribution of each class to the average score.

graf8-8

Figure 8. Items solving by thematic topics by an individual student.

Graphs show how well an individual  student have acquired thematic topics of Math curriculum at the end of the primary school.

graf9-9

Figure 9. Solving of items by blocks by a student

Graphs show how a student solved items blocks. Each of the block contains 3 items of each level.

graf10-10

Figure 10. Solving of item blocks by a class

Graphs show how students solve item blocks. Most often achieved level is marked  darker. Level that wasn’t achieved by anyone is marked blank.

graf11-11

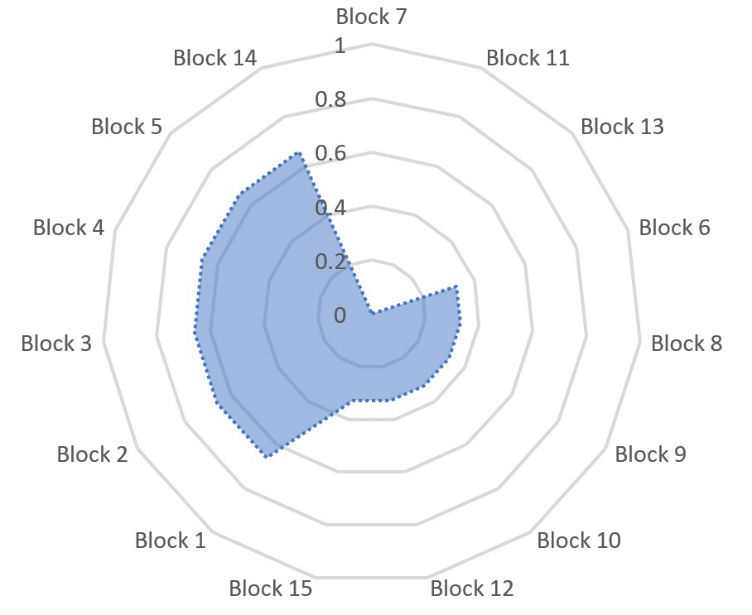
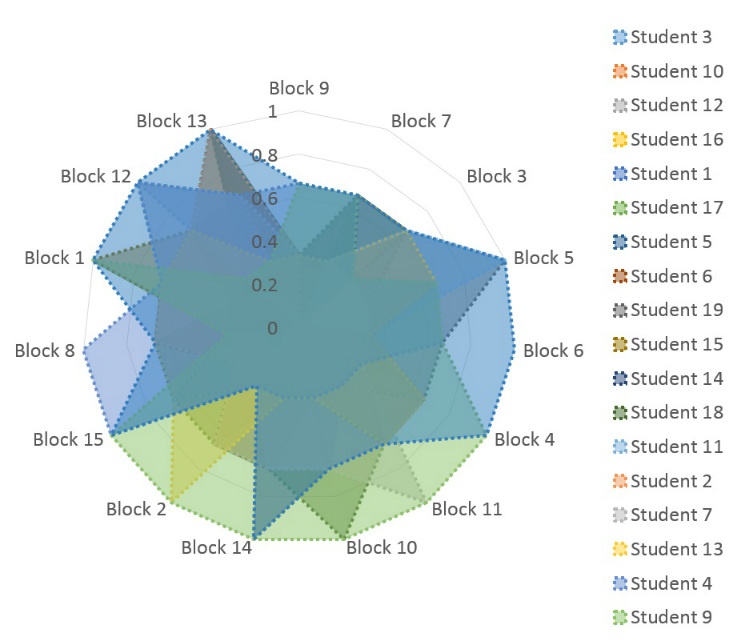
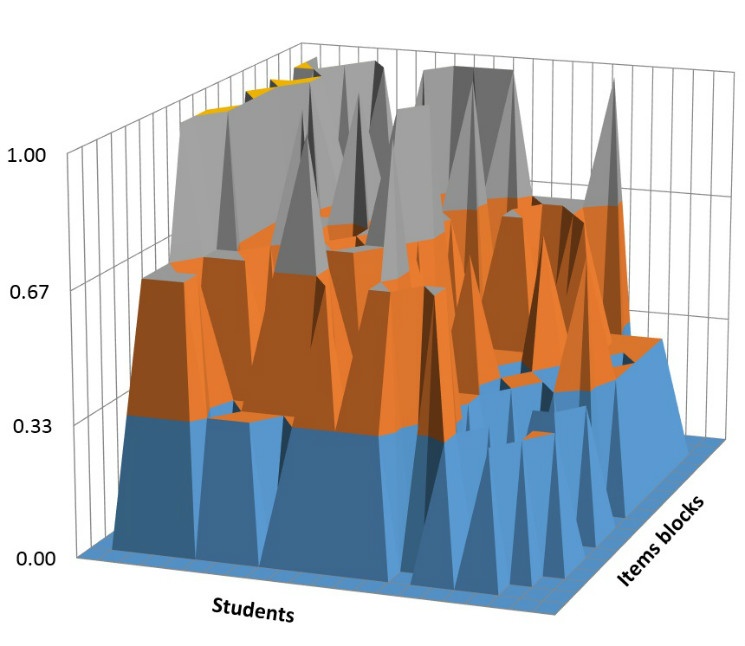
Figure 11. Solving of test items blocks by students of a selected class.

Graphs show how students of same class solve test items. Data forms a cube when class achieves the maximum result. As the level of individual achievements is not maximal, the graph forms into  un-even extensional figure. This figure points to problem spots in the class  for individual students and for least solved items blocks.

graf12-12

Figure 12. Knowledge acquisition by level for students of different age

Graphs show how students achieve levels of knowledge acquisition in the process of learning.

© 2013 All rights reserved. Impreza Theme by UpSolution