Инструмент оценки качества освоения содержания и динамики учебных достижений школьников | SAM
+7 (499) 653 51 10
sam@ciced.ru
YouTube
flagРусскийflagҚазақflagTajik
flagEnglish
  • About SAM
    • Theory
    • Authors
    • History of development
  • How it works
  • Services
  • Documents
  • Contact us
  • Seminar

How it works

Home How it works
How to design test items?
How to organize assessment?
How to interpret analysis of assessment results ?
How to improve results?
How to design test items?
Stages of test design

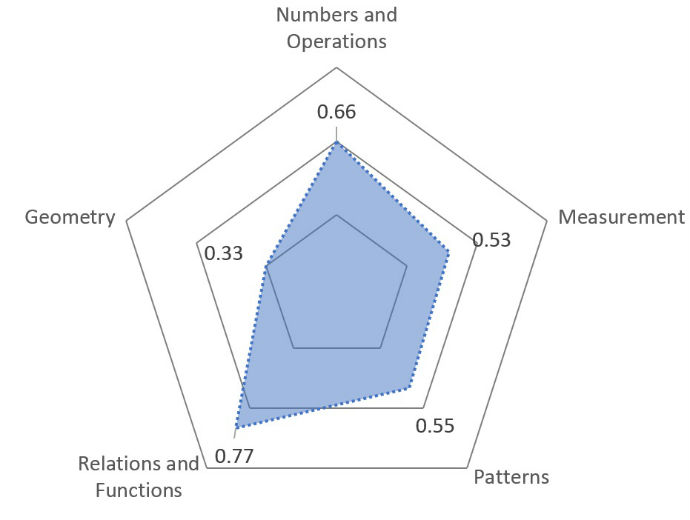
  • Development of matrix of main chapters of school subject with summary of educational goals that should be achieved
  • Identification of set of tools which acquisition is a foundation related to this chapter
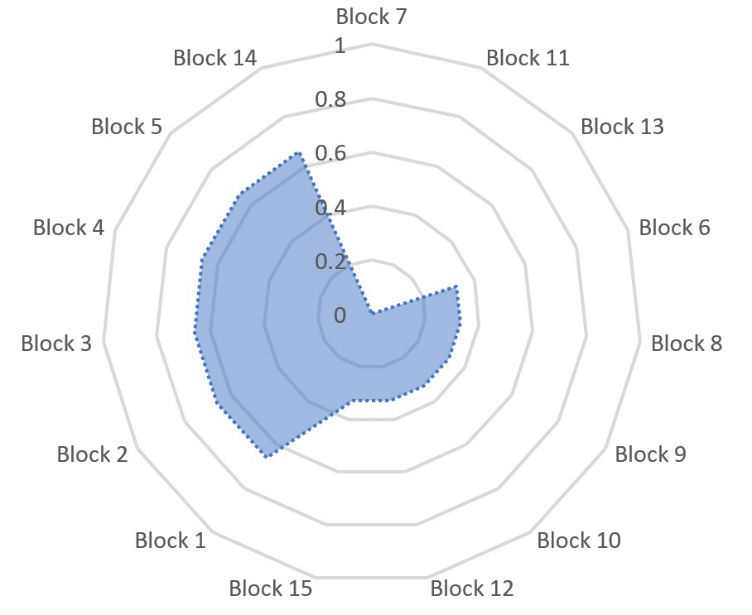
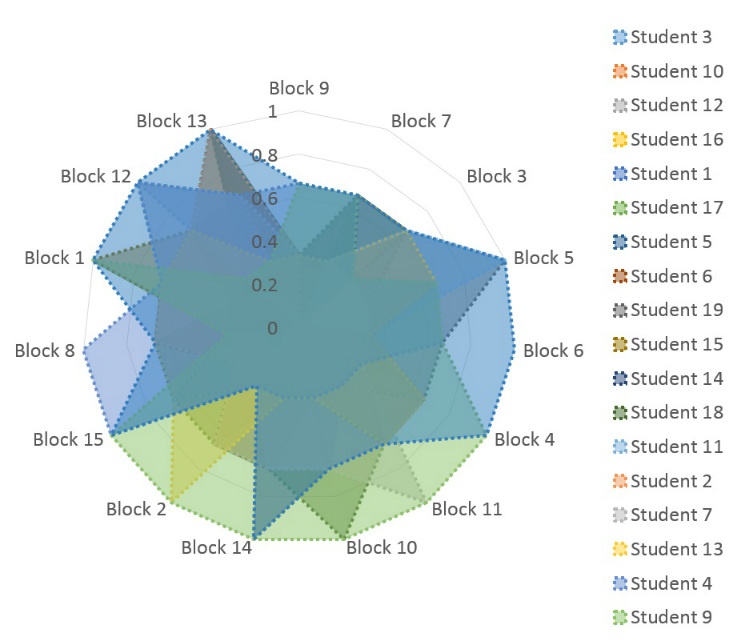
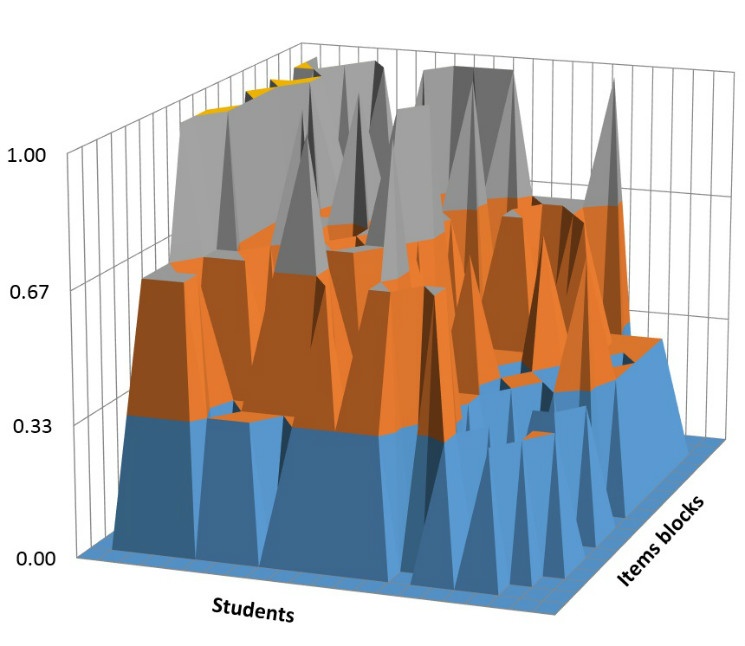
  • For each chapter a few blocks of items should be developed. Each of the blocks has items of 1st, 2nd, 3rd level
  • Within the block items should form hierarchy by level of difficulty, item of the 1st level is the most simple, item of third level is the most difficult.

Due to such design each block functions as a detector that determines level of knowledge acquisition.

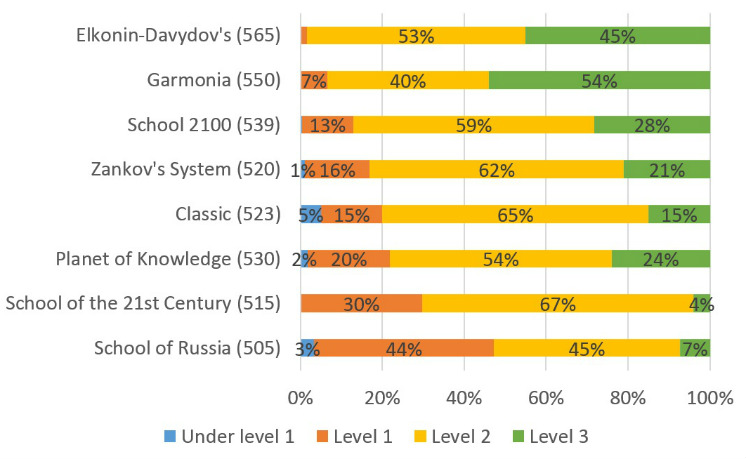
Three levels of items corresponds to three levels of knowledge acquisition

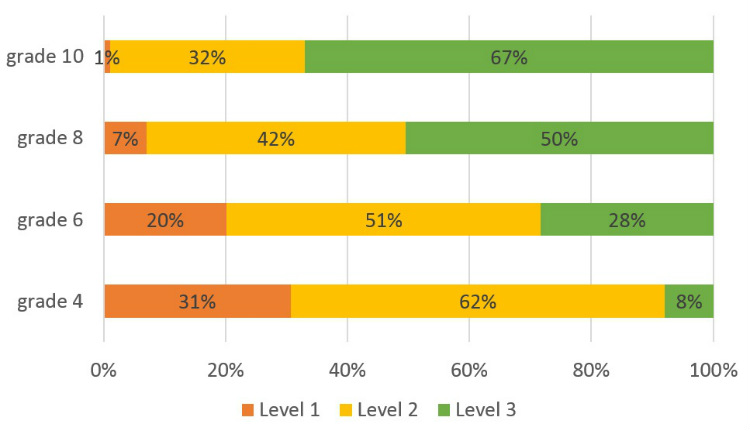
First level (procedural knowledge)

Student orientates  towards external (descriptive) features of the problem. It allows  to identify it as belonging to a particular category  and to invoke an algorithm used for this category of problems. In this case, the description of a problem can be associatively linked to a learned procedure. The formulation of the problem contains direct clues about the required operation, namely division.  The problem is presented in a standard way that should be familiar to a student who has learned the corresponding topic. The student still has to know how the algorithm works and some students, especially at the early stages of learning, may find it challenging to follow the steps of the procedure. However, once the procedure is mastered, there is no need to discover new ways of applying this knowledge outside of a standard context.

Second level (conceptual understanding)

Solving problems at this stage generally requires understanding a principle, or a fundamental relation underlying a particular concept. The problems of this level are often formulated in a way that makes it difficult to map their description onto a given algorithm. The student needs to analyze the meaning of the problem, which may require transforming its description in order to understand how to approach its solution.

 Third level (functional competence)

Students must develop the depth of understanding and conceptual flexibility that will allow them to see a full range of possiblemental “moves” within the problem space and identify the sequence of moves that leads to a solution. At level 3 it necessarily requires that the child compares multiple ways of approaching the problem. In a way, the child should carry out a series of mental experiments and compare their results.

How to organize assessment?
SAM test is designed in 2 forms:

  • computer based
  • pen and pencil

Testing time is 80 minutes (two 40 minutes lessons) .

Number of items in test booklet is 45

For testing you need:

Pen and pencil form: pen and test booklet. Calculator, test book, ruler are not needed.

Computer-based form – computer with software installed (off line version) or Internet connection (online version).

Tasks of open type are used in test with possibility for short or longer answer

Following students exclude from testing:

  • disabled
  • with development defection
How to interpret analysis of assessment results ?

To illustrate SAM features we use the research that took place in one of the Russian cities. In frames of this research all students of 5th grade of all schools were tested.

Figure 1. School rating by average score. All students participated in testing.  

Graphs show school rating by students average score

Figure 2. Structure of schools average score

SAM allows to see the structure of school’s average score with % expression of students at different levels.

Figure 3. Distribution of students by levels

Graphs represents how the structure of the average score of particular school is formed.

Figure 4. Students individual data on solving of test items of 3 levels 

Graphs show profiles of  students of the same class.

Figure 5. Average score of classes in relation of used teaching approach

Graphs show average scores in relation to the approach  that was used for teaching.  Rating contains all schools.

Figure 6. Structure of average score of classes in relation to the used teaching approach

Graphs show average scores in relation to the approach  that was used for teaching. Rating contains all schools.

Figure 7. Structure of average score of a school. Different teaching approaches are used in different classes.

 Graphs show the structure of school’s average score. Graphs feature that different teaching approaches  are used in classes. Graphs show the quality of knowledge acquisition in every class and as the result – the contribution of each class to the average score.

Figure 8. Items solving by thematic topics by an individual student.

Graphs show how well an individual  student have acquired thematic topics of Math curriculum at the end of the primary school.

Figure 9. Solving of items by blocks by a student

Graphs show how a student solved items blocks. Each of the block contains 3 items of each level.

Figure 10. Solving of item blocks by a class

Graphs show how students solve item blocks. Most often achieved level is marked  darker. Level that wasn’t achieved by anyone is marked blank.

Figure 11. Solving of test items blocks by students of a selected class.

Graphs show how students of same class solve test items. Data forms a cube when class achieves the maximum result. As the level of individual achievements is not maximal, the graph forms into  un-even extensional figure. This figure points to problem spots in the class  for individual students and for least solved items blocks.

Figure 12. Knowledge acquisition by level for students of different age

Graphs show how students achieve levels of knowledge acquisition in the process of learning.

How to improve results?
Analysis and use of the testing results

Municipal Education Management Authorities

Municipal education management authorities can be interested in the following set of indicators:

  • Test score – class / school / city
  • Distribution of students by grades of achievement – class /school / city
  • Test score for each content area – city
  • Distribution of students by grades of achievement for each content area – city


The city-average test score gives an indication of the general level of educational outcomes for the school network as a whole. This scale score can be directly compared to region-average statistical indicators, as well as similar data from other cities (or regions) thus allowing a comparative evaluation of the local school system.


School- and class-average test score enables to evaluate the achievements of each school and class as compared to other schools and classes, both local and those located in other cities.


In the context of education management objectives, it is important to identify classes with achievements corresponding to the sociocultural norm with a view to reveal a group of efficient teachers who can share useful experience. In the future, such teachers could be engaged in various educational events at the city level.


Distribution of students by grades of achievement is a highly informative indicator for an education manager. At the city level, it characterizes the qualitative composition of the student population. The data can be compared to similar indicators at the class and school level to identify “problem zones”.


Attention should also be given to schools where a substantial share of students demonstrates the first level of assimilation, i.e., fail to comply with the cultural and age norm. The norm was derived from theoretical considerations, and is still being tested and compared with actual data. Nevertheless, non-compliance with this norm should rather be kept in sight.


Distribution of students by grades of achievement at the school level is a measure of child population homogeneity in terms of academic achievements. The factor of class homogeneity/inhomogeneity has long come up to the attention of educationalists. There are at least two points of view on this matter: a) one should strive to ensure homogeneity through segregating students with different levels of achievement in different classes and schools; b) inhomogeneity is useful, provided that students with different achievements are equally represented in a class (school).


In this case, application of SAM will provide an unbiased framework for evaluating the students’ homogeneity/inhomogeneity in terms of academic achievements.


Context specialists can be interested in the analysis of specific context area assimilation based on comparison of relevant test scores and distribution by grades of achievement at the city level. Such data can be useful for defining priority steps to improve education methods and professional upgrading of teachers.


School administration


School administrations are interested in:

  • Test score – class / school / city
  • Distribution of students by grades of achievement – class / city
  • Profile – class


Average test score of each class in the given school and city enables to compare classes between themselves in terms of academic achievements, and also to compare school outcomes with those at the city level, as well as with the sociocultural norm. Awareness of such information allows the administration to evaluate the position of their school in the education environment of the city and region, as well as assess the chances of their students to continue education at universities.

Individual test scores enable to identify the most advanced students for participation in city olympiads.

It is also important for the administration to have an understanding of the students’ distribution by grades of achievement. These data, which characterize the zone of students’ proximal development (ZPD), can be useful to identify potential vectors of actions with a view to improve overall academic achievements. This information is also relevant for addressing the issue of academic homogeneity/inhomogeneity in individual classes. In addition, the administration thus obtains some grounds to inform decisions on methodological support to teachers, in particular, through sending them to professional upgrading courses.

Profile of a class, which shows a relative share of completed items in the given test, in comparison with profiles of parallel classes, as well as model testing results provides some information on the teacher’s strategy and its focus on achieving a certain level of content assimilation.


Teachers

Secondary school teschers

This category of users is primarily interested in distribution of students by grades of assimilation of the primary school curriculum. This indicator allows the teachers to get some prior insight into what share of students would likely face difficulties in the assimilation of new concepts. The same distribution that characterizes the structure of student population will provide some basis for defining the teaching strategy: timing and forms of subject content presentation, ways of organizing students’ communication in class, etc.

It is advisable that basic school teachers who get relatively poorly achieving classes should try and fill the gaps in the assimilation of primary school content as part of new content presentation, and, by the end of the 6-th grade, conduct another testing using the SAM toolkit for primary school.

It is also useful to apply the SAM toolkit in the 8-th or 9-th grades to identify students who complete the tests at the level of absolute cultural norm.

Primary school teachers

Primary school teachers can elicit the greatest amount of useful information from the SAM toolkit and results of its application. The mere familiarization with the SAM toolkit provides references for the understanding of key aspects of the educational process: a technological framework of the test which defines the primary units and sections of the subject content; a three-level system which models the process of content assimilation; types of test items structuring the scope of subject content. When assimilated, this system of generalized concepts will supplement the set of references for the educational process organization and management.

As to the results of exit testing, they allow the teacher to objectively evaluate his/her performance, analyze the successes and failures, and outline approaches to the work with newly enrolled students.

Primary school teachers are interested in all SAM indicators characterizing individual students and classes:

  • Test score – student / class
  • Grade of achievement – student
  • Distribution of students by grades of achievement – class
  • Profile of achievement – student/ class
  • Matrix of primary estimates for each test item – student/ class


Test scores of individual students and the class are scale indicators that help the teacher to evaluate the achievements of each student in comparison with those of his/her classmates and students from parallel classes, achievements of the whole class in comparison with parallel classes, as well as compare these indicators with the average statistical data and sociocultural norms.

Grade of student’s achievement is a qualitative indicator that can be evaluated in comparison with the age norm.

Distribution of students in the class by grades of achievement provides an insight into the composition and number of groups differing in the attainment level. The distribution pattern enables to evaluate the way in which the educational process is organized in the given class.

The above three indicators (shown on the metric scale) provide the teacher with a sound basis for retrospective analysis of his/her performance. In addition, testing results contain additional information enabling to detalize the concluding picture of learning.

Thus, the profile of achievement in the class, being compared with profiles of parallel and model classes, allows the teacher to better understand the actually implemented teaching strategy and the focus of applied teaching methods.

Profiles of individual students’ achievement allow the teacher to evaluate their learning trajectories, and compare unbiased data with his/her intuitive perception.

And finally, the matrix of primary estimates for each test item, given that test books are available to the teacher, provide an extensive factual information enabling to analyze the difficulty of certain test items for the class or individual students.

© 2021 SAM (Student Achievements’ Monitoring). CICED